WTFunding: Space Data (Satellite Imagery)
WTFunding is one of my “spare time” projects to delve into tech sectors attracting VC funding that pique my curiosity. I like connecting dots between disparate things, it’s also pretty useful.
Table of Contents:
- So what is “space data” and “satellite imagery”?
- What are the applications?
- What’s hindering adoption?
- Who cares?
- What are the risks?
- What’s the current scene?
- Conclusion
So what is “space data” and “satellite imagery”?
I derive a lot of pleasure by calling it “space data,” but it is more accurately termed satellite or geospatial imagery, and the analysis thereof. This is all about image data collected by satellites about the Earth’s surface and the software that helps make these images useful to humans.
To get to the final, useful image, there are three main steps: launching a satellite into orbit, collecting the images of the Earth’s surface, then processing and analyzing the images. While image processing & analysis, with the goal of gleaning intelligence from satellite imagery, is drawing the most VC funding at the moment, it’s important to understand each step to get both the opportunities and risks startups face within this sub-sector.
If you are more of a tl;dr person, you might want to skip down the page a bit to the next section, “What are the Applications?” and continue from there.
Step 1: Launch to Orbit
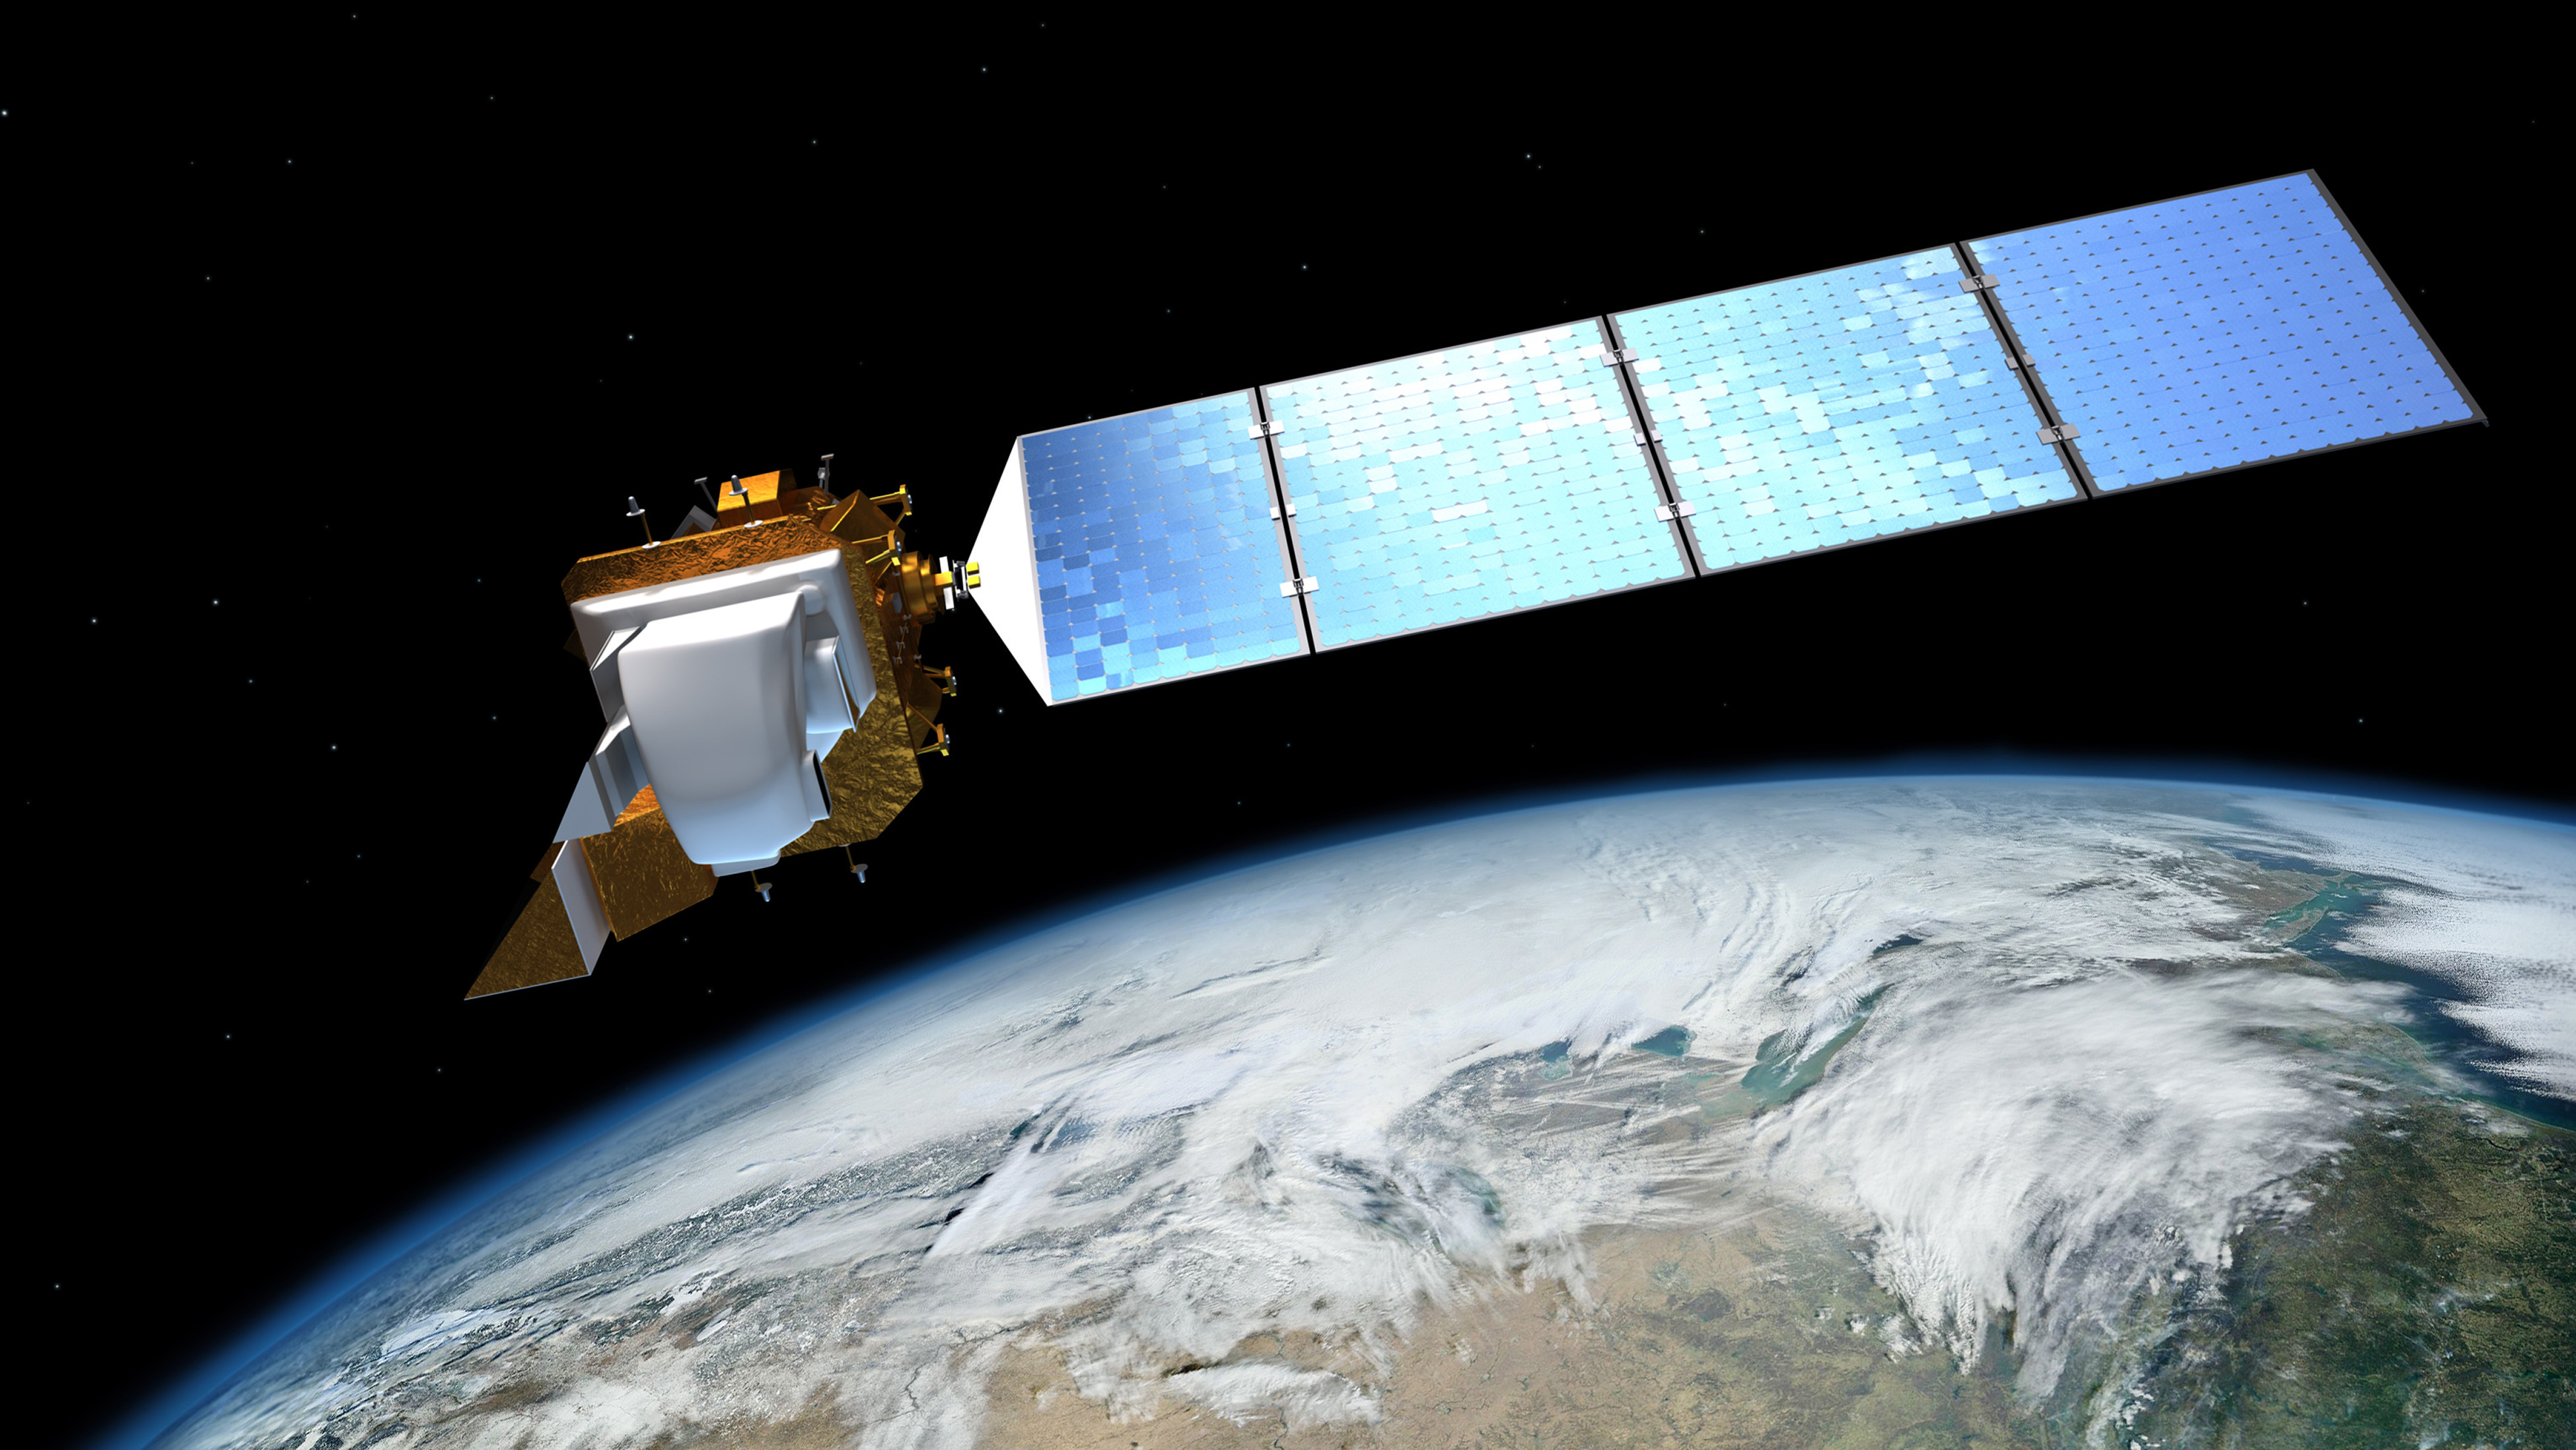 Landsat 8, an Earth Observation satellite operated by NASA.
I’ll be focusing on remote sensing satellites, but there are also communications and weather satellites and reconnaissance (aka spy) satellites and maybe even satellites that can shoot lasers out of the sky (nothing is beyond their reach, after all). First, let’s cover some basics about satellites.
Rockets are the things who take satellites on their journey into Earth’s orbit. Earth’s gravity is what keeps satellites in orbit, just like how gravity causes the Moon to orbit us. Satellites are fitted with gyroscopes, spinning discs that leverage the Earth’s magnetic field to keep the satellites on course. Solar panels power the satellites once they’re in their proper orbit, since they have nice access to the Sun’s rays.
There are three different types of orbit: geostationary, geosynchronous and polar (or sun synchronous). Geostationary means that the satellite is stationary relative to the Earth’s surface. Communication and weather satellites use this orbit, staying way above the Earth at a specific point on the Equator (way above = 30k+ km). Polar (aka sun synchronous) means the satellite orbits at an altitude at which it will consistently pass over a given location at the same local time. This is what remote sensing satellites use, and are typically closer to the Earth’s surface than the communications satellites (only hundreds of km above).
Step 2: Data Collection
Objects on Earth reflect energy from the Sun. This energy is in different “bands,” typically visible, infrared and water vapor. Each object reflects a different amount of energy, giving them a “spectral signature.” “Remote sensing” is how satellites collects these reflections — and just means sensing the energy bands from a remote place (like the Earth’s orbit).
 How remote sensing works (no animals were harmed in the making of this image).
Satellites carry sensors that allow them to do this remote sensing. Passive sensors just collect the reflections (radiation) that are emitted from Earth, using the Sun’s energy as its source of electromagnetic radiation. Active sensing systems carry their own source of electromagnetic radiation, which is directed to the Earth’s surface. Just like the passive sensing system, it then measures the amount of energy that is reflected back.
Different sensors are designed to measure different parts of the electromagnetic spectrum. For example, the 450nm - 495nm wavelength band would measure the visible color blue. The 570nm - 590nm wavelength band would measure the visible color yellow. And near-infrared is the ~700nm - 1mm wavelength band.
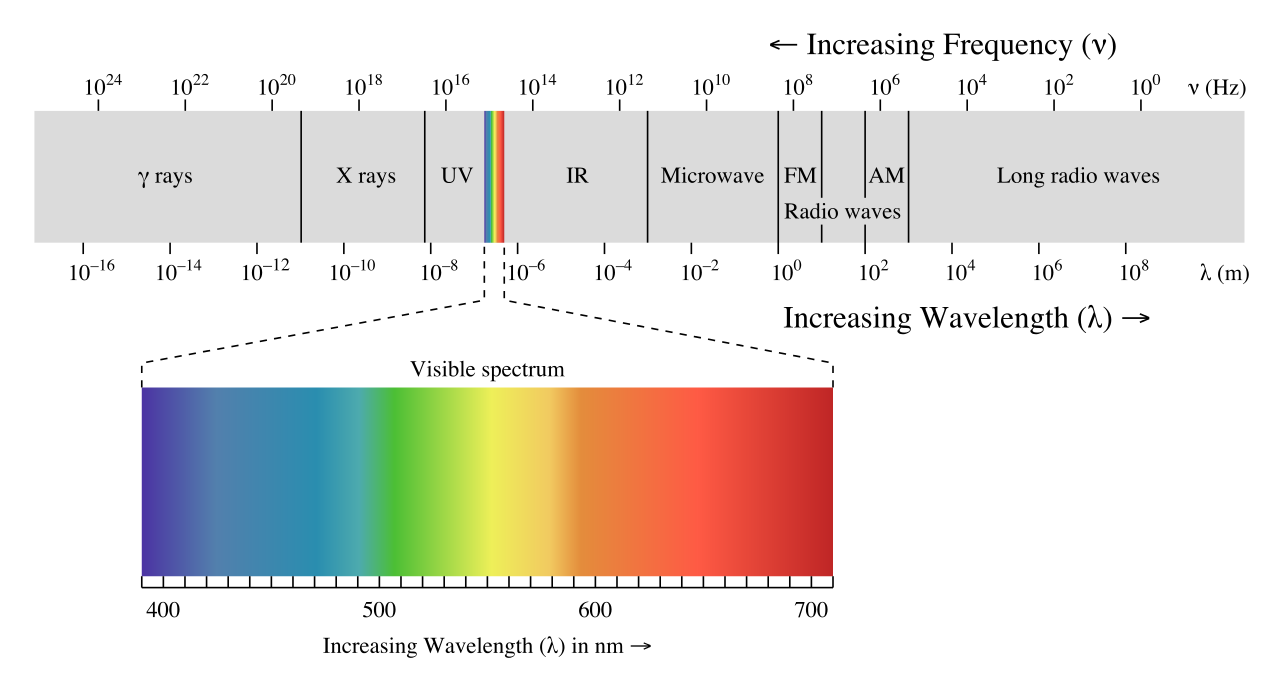 The Electromagnetic Spectrum
Luckily, the electromagnetic spectrum is pretty handy for identifying objects. The way objects reflect back energy is consistent and tends to be unique. Water doesn’t reflect much visible or infrared energy, but vegetation strongly reflects infrared.
Satellites can even be used for things like detecting gravitational pull on the Earth’s surface. If you have two satellites, one leading and one following, when the lead passes over an area with high gravitational pull, it’ll start speeding up (and slow down over areas with weaker gravitational pull). NASA launched twin satellites in 2002 to do just that (GRACE mission). Being able to detect gravity helps map out areas below the Earth’s surface, from tunnels to potential oil wells.
Capturing lots of energy/wavelength bands creates what are called “multispectral images.” This means that the final image contains a few layers of images that each capture a different energy band. For example, one layer might capture the infrared band while another might capture the green band. You can even have superspectral and hyperspectral, but that just means there are lots and lots of layers with different energy bands. The more bands, the more opportunity for differentiation of objects on the ground. On the opposite side of the spectrum (pun intended), panchromatic images capture a single band of energy in black and white (and shades of grey).
As the satellite orbits around the Earth, it looks at a small chunk of the planet at a time. Even if it goes around the Earth every few hours, it is only capturing as little as less than 1% of the Earth each time. This small chunk is represented by a pixel, just like on your TV or computer monitor. For example, one pixel could represent 50x50m on Earth. Different types of sensors allow for different pixel sizes, typically from 5m to 1km — though some have pixel sizes as small as the micrometer scale (and tend to capture a smaller portion of the Earth as a result).
As the satellite orbits, it has to capture as many pixels as it can. However, even if pixel size is the same among different sensors, this doesn’t mean the resolution is as well. Higher resolution is indicated with a smaller physical measurement; for example, an image with a pixel size of 5m will look much clearer with a resolution of 5m vs. 20m.
According to one news report, in 2013 a spy satellite was launched in California capable of “snapping pictures detailed enough to distinguish the make and model of an automobile hundreds of miles below.” Given the length of a car is approximately 5m, let’s assume that the resolution needs to be 10% of that in order to see the necessary level of detail about the car, so 0.5m or smaller. And we’d likely assume that it isn’t just panchromatic since the government likely also wants to know the color of the car. This makes it quite a bit more powerful than most commercially available multispectral resolutions. As a frame of reference, DigitalGlobe’s satellite scheduled to be launched in September 2016, the WorldView-4, will have a multispectral resolution of 1.2m.
When reading about a satellite’s imagery capabilities, it’s crucial to understand that pixels and resolution are not the same thing. The difference between a pixel and resolution is that resolution is the size of the smallest detectable feature captured whereas a pixel is the size of the smallest physical area captured (or in other words, the smallest unit of the image).
There are also different types of resolution. Spatial resolution depends on what’s called the sensor’s “Instantaneous Field of View” (IFOV), which just means the visibility the sensor has at a particular altitude at a particular moment in time. Spectral resolution just means which parts of the electromagnetic spectrum the sensor can capture; higher spectral resolution indicates a narrower band of wavelengths captured. Radiometric resolution measures how many shades of grey there are between black and white, measured in bits; an 8-bit radiometric resolution means the sensor can measure 256 unique shades of gray. And temporal resolution is the length of time it takes for the satellite to complete one orbit; for example, some satellites may capture the same area every 5 days, while for others it will be every 15 days.
Another important thing to keep in mind is that satellites are not necessarily taking photographs; these sensors are not cameras (though those spy satellites sometimes do use long-focus lenses). The mechanism is through sensing energy bands. Hence the industry lingo is remote sensing. Each image represents a lot of pixels arranged in rows and columns — think of it like putting a fragment of an image into 1,000 rows by 1,000 columns in Excel, and then zooming way out to see the full picture.
![]()
To continue that analogy, that Excel file would then represent what’s called a “scene.” Scenes can represent over 2,000km on each side. These scenes are what most people buy since they want the “big picture,” not a tiny snippet of whatever is being observed.
![]()
Again, this scene represents a physical object on the Earth’s surface. In our cat’s case, let’s say it’s just over a foot tall sitting upright, which is about 0.33m. In the scene, we can see the entire physical object (the cat) and features as small as its nose, so using its nose as a proxy for the smallest detectable feature, our resolution is approximately 0.01m — meaning we’re likely using a super secret spy satellite to spot Mr. Whiskers.
![]()
Multispectral scenes can represent a large amount of data, often with tens of millions of bytes (10MB+) per scene. This is because the intensity of each pixels is stored as a single byte (an 8-bit digital number), and there are typically millions of pixels in any given scene. Recorded video can hog even more data, and high quality video is a more newly available product — and typically no longer than two minutes. How video can be used to track objects on the ground is a longer discussion that mostly talks about error correction.
Step 3: Image Processing & Analysis
This is just where the fun begins! Now the imagery needs to be processed, in what’s novelly called “image processing.” This just means a human uses a computer to work with the images. Having higher spatial resolution and more data doesn’t mean you’ll necessarily get more information out of the images — and that’s why image processing is so important.
Why is there a human required, you might ask? While it’d be fantastic to have automated image analysis software that can intelligently scan images and highlight relevant objects or issues, that’s not the current state of things at all. Humans still sadly need to be involved to help with filtering and classification based on their project goals.
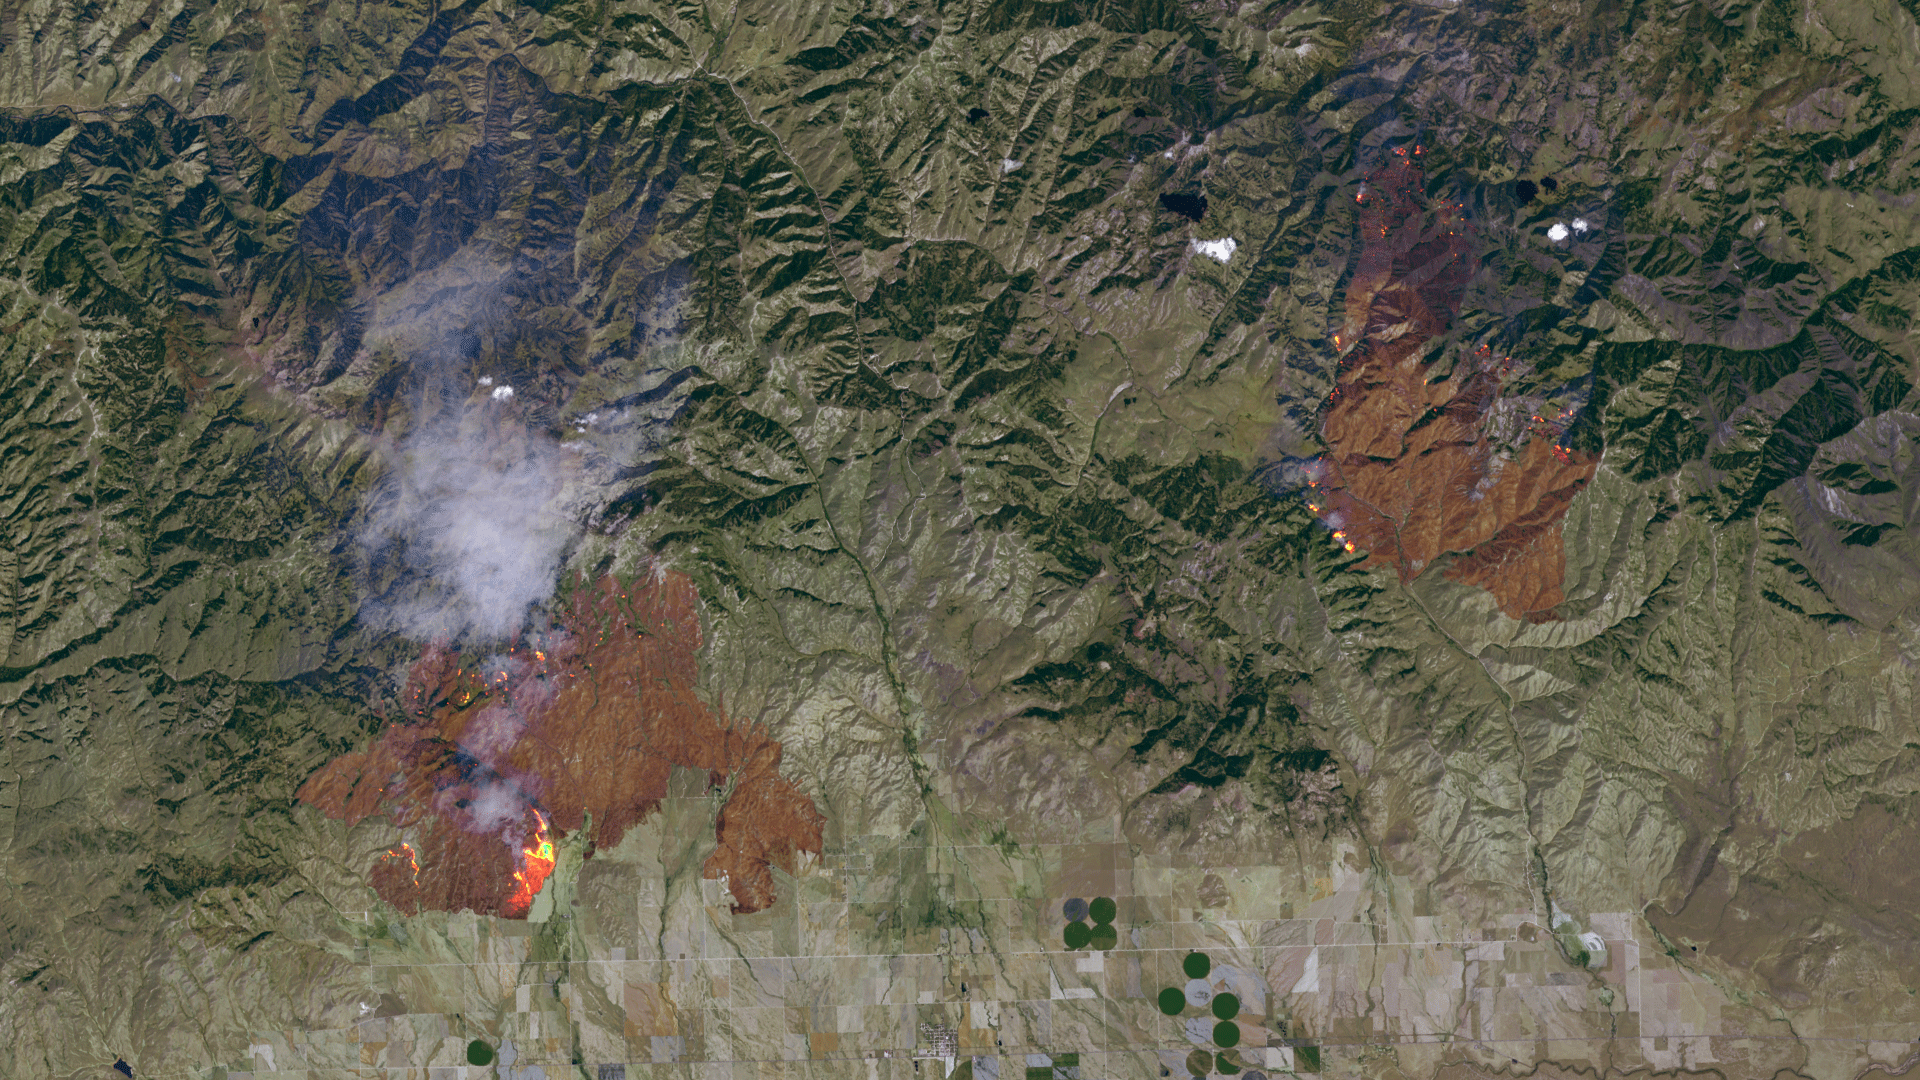 Satellite imagery of wildfires in Idaho
Processing is part of image analysis, which requires special types of statistics and analytical methods that are tailored for spatial data — though primarily anchored around interpolation (predicting new, unknown data points within a group of some known data points). There’s an emphasis in geostatistics in being able to estimate how much the gaps that are filled in via prediction might be wrong; things like elevation for 3D modeling are particularly tricky to determine aerially, so there is ripe opportunity for error. One example method is kriging, which helps predict the appropriate values in unobserved locations by using a weighted average of surrounding areas and estimating its accuracy.
For satellite imagery, there are software tools that have been developed with the specific use case of geospatial imagery processing and analysis in mind. These tools are called geographical information systems (GIS for short). The usual aim of image processing is to create an image that makes sense to a human — in essence, make the energy band sensing look more like a photograph. Or more simply put, “what the heck is in this spot?”
At a higher level, the end goal from all of this is information extraction. Even with basic mapping (like Google Maps), the point of the image is to gain some insight about stuff here on the ground. The type of information that is desired can be different between applications (which I’ll discuss later), and very rarely is available with just the basic image taken. Thus, humans need tools to help extract information from the images.
The typical chain of image processing is data import, image restoration & rectification, image enhancement and information extraction. The methods for performing this processing chain have been shifting somewhat in recent years. Now, satellite data can be retrieved via APIs and similarly are various tools for processing made available via APIs. But, to understand some of the challenges, it’s important to walk through these steps.
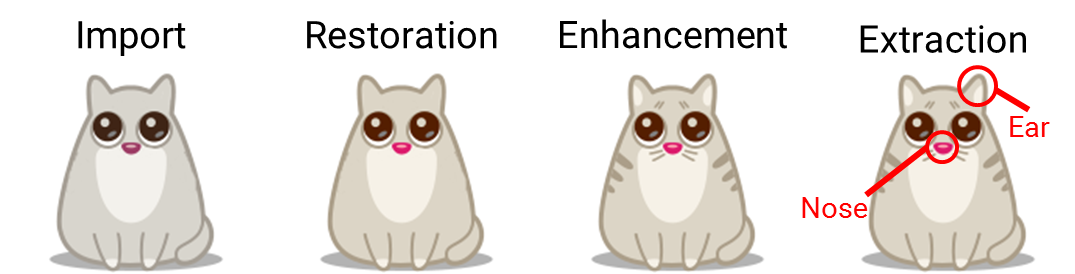
Data Import
While spy satellites might take actual film, eject it and have it intercepted by military aircraft, the process to transmit imagery back to Earth isn’t quite as cool for commercial satellites. As the satellites orbit around the Earth, they send data down (“downlinked”) via directional antennae to receiving stations on Earth. They can also receive instructions on what to capture, which are sent up from Earth (“uplinked”). These communications are conducted over the X-band, a specific frequency range.
The images the satellites take are generally compressed on-board, with their total storage nearing a terabyte. Some can even perform image fusion (which is discussed shortly) before transmission to help improve the image’s resolution.
There are various GIS data formats and different types of data that can be imported. Much like in my prior post, a number of different vendors have their own data formats, and they are often proprietary, making a lot of big data analysis stuff a lot harder. There are also unique data formats for specific parts of imagery – such as the feature geometry, feature attributes, topology, etc.
Satellite imagery is commonly stored in digital numbers (DN), which means each pixel gets a value in 8-16 bits for a physical value (like color or temperature). This helps minimizing the storage volume.
There are a number of geospatial-specific database management systems (DBMS), which is software used to store GIS data to allow it to be later retrieved and modified – essentially the tool that helps organize data. This is actually an important part of image processing, since it allows for querying and comparisons across different pieces of data.
Most of the time, this data is stored in distributed systems, which just means it isn’t all in one database. Distributed databases optimize scalability, which is why they are used in this use case, due to geospatial data’s typically large file sizes.
The relational database model is the one that is primarily used for GIS data. I’ll skip an explanation and discussion of the various database systems and types for now, but if you aren’t familiar with them, here’s a link to the Wiki.
Analysis techniques are used to create and define models of relationships between different data sets. The traditionally used technique is the entity-relationship model. In this, there are specific entities, like buildings, forests, and agricultural land, which have different attributes and “members” of the entities (like government, residential or religious buildings). The relationship part of entity-relationship just means members of these entities are compared; for example, you could compare different residential buildings in New York City to determine what attributes they have in common (perhaps they have rooftop gardens, are thinner, etc.).
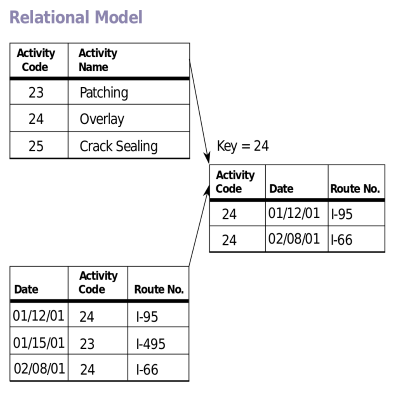
The relational model works well for this sort of data, since it allows for different datasets to be compared. The key (pun intended) here is that there are keys for each entry in the data sets that link the data sets between each other.
Using a relational model for databases allows the humans to make queries with the Structured Query Language (known best by its acronym, SQL). You can make a query such as: select all buildings with rooftops within 100km of Union Square in Manhattan. Each building will have a specific coordinate (i.e. spatial relation), and (which we’ll cover in a few paragraph), can be marked as having a rooftop. Geographic search is the most important query out of these, and a large part of why there are geospatial-specific DBMS.
There are two types of data stored in these systems: spatial or attribute data. Spatial meaning “georeference” (i.e. location on Earth), and attribute meaning feature-related data (normally stored in tables). From the example above, the building coordinates are within the spatial data, and whether they have rooftops is within attribute data.
Spatial data has two further subcategories: vector and raster. Vector data deals with geometry in a few different ways. Think 2D, like boundaries of forests, or 1D (lines), like following the path of a river. You can also have specific spatial points that represent a particular item, and they are technically 0D. Raster data represents surfaces, but not just as far as 3D things like elevation; it can also show things like population density or temperature.
Raster data is where our spectral data comes in, along with the actual imagery and topography. Each cell (remember, this means pixel) gets assigned a specific value based on its primary feature. For example, one cell may have vegetation assigned to it, while another may have water.
GIS software will link all this data and create these models with a specific structure. Typically, it will start with geometrical information, then add topological and finally thematic (the raster data). This order is logical since geometrical represents the physical form and position of objects, topological is about relational position (intersections of objects), and thematic adds in the detail about objects (typically in layers).
There’s some trickiness in importing and managing this data, however. The data needs to be both accurate, meaning the map needs to match real world values, and precise, meaning described as exactly as possible. The distinction is important; you can have a map perfectly overlaid on real coordinates (accurate), but showing “this area is green” rather than a breakdown by type of vegetation (imprecise). Similarly, you could have detail down to different types of weeds (precise), but your coordinates are a mile off (inaccurate).
I’ll get into more of the challenges later, but it’s important to touch on how these errors happen, most of which are during processing. Formatting data can cause scaling to change, the data can be outdated, or there could even be an errant sensor. There are issues even with positional accuracy as far as non-land things go — it’s a lot easier to accurately determine the boundaries of a lake than the boundaries of population density.
There will also be labeling errors, whether by humans or automated processing. If I saw an image showing there was a Magnolia tree forest in some region of China, I’m unlikely to know if that is the correct type of tree in the forest or not.
These errors can snowball and ultimately make the entire analysis worthless, which is why they are such a big deal. A mining company starting a drilling project for gold in a specific spot will be none too pleased when the imagery they used actually was kilometers off, or showing the wrong type of mineral.
Some can be mitigated by supervised classification, in which a human selects an area of land they do know a lot about so that the software can then classify other areas accordingly. But that’s an inefficient and time-consuming process that requires domain expertise — so, far from ideal.
There are new sorts of structures being developed to improve object retrieval from satellite imagery databases. Some involve automatically extracting objects from imagery, then encoding their descriptors into much smaller (<1% of original imagery) sizes. This allows for very fast retrieval by object shapes, which seems like a nice improvement.
Image Restoration & Rectification
Processing might start with getting true color on the images (i.e. making it look like a photograph, with blue water, green forests, etc.). You might be familiar with RGB values, (255, 255, 255 being white), which represent an 8-bit image color range. Sometimes it’s better to have false color, which just means using unnatural colors to help highlight differences between energy bands. If your goal is to see levels of vegetation, then you may prefer a false-color composite (FCC) that lets the infrared bands really pop.
 False color imagery
After that, you might want to make sure your image is accurate, or what is called “georectification.” You can use what are called ground control points (GCP), which just means using the coordinates of known locations on a map in order to make sure the image’s coordinates map the real physical location. There’s also “orthorectification,” which removes issues of scale by accounting for different tilts and terrains — the more diverse the Earth’s surface is, the more likely there will be distortions in the image.
There are a few different ways images can be distorted or have irregularities, and thus different techniques to help restore them. One such technique is resampling, in which a pixel gets assigned a DN based on the DN’s of its neighbor pixels. Another is radiometric pre-processing, in which corrections are made to handle noise or irregularities generated from the sensors so that only the actual reflected radiation shows on the image.
Since satellites can’t control the weather (and weather modification is banned), there’s often the need for atmospheric correction, such as cloud removal. Since remote sensing is based off of how the sun reflects off objects, there can also be variations in the angle of the sun that need to be taken into account.
Image Enhancement
The image enhancement phase is to improve the quality of the imagery. Some enhancements are familiar due to their use in photography, such as contrast enhancement to help highlight the differences within an image. Spatial filtering involves directly manipulating pixels for some effect. If you’ve ever played around with filters in Photoshop, or even on your phone, you get the picture. These can include image sharpening or softening, embossing, etc.
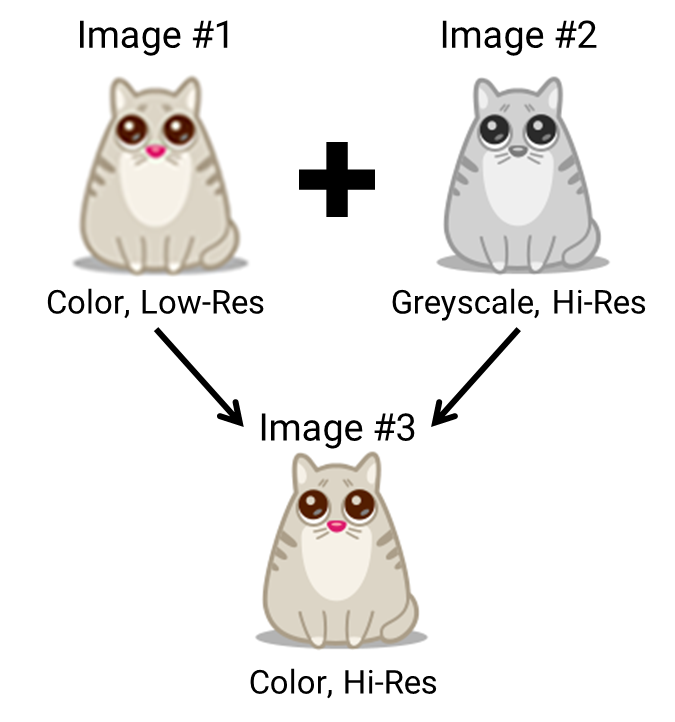
A common technique for enhancement is image fusion, which seeks to create a single, more detailed image out of multiple images. It’s also one of the ways that the tradeoff between spatial and spectral resolution can be solved.
There are a few different levels at which image fusion can be performed. First is at the pixel level, comparing pixels in different images to figure out how to pack in more detail into a pixel. Second is at the feature level, comparing sizes, lengths, shapes, etc. of the same geographic area and using statistics to combine the highest-intensity features out of different images. Third is object-level, the highest-level type of image fusion, in which images are processed separately and then combined using fancy algorithms to help maximize intensity.
There are limitations of image fusion, such as color distortion and poor quality when dealing with high resolution images, but apparently these problems are expected to be alleviated as technology improves.
Information Extraction
Image classification is the largest part of information extraction, and means each pixel (or, more recently, object) in an image is categorized. This is important to distinguish different objects within an image and ultimately extract information from the image. For example, if you are measuring how quickly a city is expanding, you’ll want to be able to classify buildings, or even particular types of buildings.
Classification typically involves the computer (or software tool) automatically distinguishing different types of objects — like water, grass, urban areas, forests, etc. These tools aren’t perfect, not only as a function of pixel size but also that the bands of energy that objects emit may be too similar to properly distinguish them.
For pixels, there’s unsupervised and supervised classification — if you’re familiar with machine learning, you’ll already get what that means. The shortest difference is that unsupervised classification involves examining unknown pixels in an image, while supervised means examining known pixels.
Unsupervised classification will compare the unknown data with reference data as a way to figure out the category of the unknown sub-area. It’s a manual process, with the user having to choose how many clusters, or groups with similar properties, to be generated, and then match clusters with classes. It’s arguably more accurate than supervised classification, but it’s also more tedious due to its more manual nature.
Supervised classification will take the known data in an image, compare it with reference data and use it to extrapolate categories for the unknown parts of the image. The process is typically “training” the classification engine on sample imagery, selecting specific features, applying the right algorithm, then determining how well it worked or not.
Some issues with classification are similar to those in machine learning — you need reliable comparison data and strong sampling data in order for it to work, which is why unsupervised is often preferred.
There’s also object-oriented image classification, or “multi-resolution segmentation,” which is a non-traditional approach (meaning it’s only come into use in the past decade or so). As the name suggests, it creates objects by grouping pixels rather than classifying individual pixels. The resulting objects have different shapes and scales, and thus can be classified more flexibly using different image layers (e.g. population density, infrared, elevation, etc.). The user is still doing supervised classification using samples and fancy algorithms, but with more accuracy when dealing with objects vs. individual pixels.
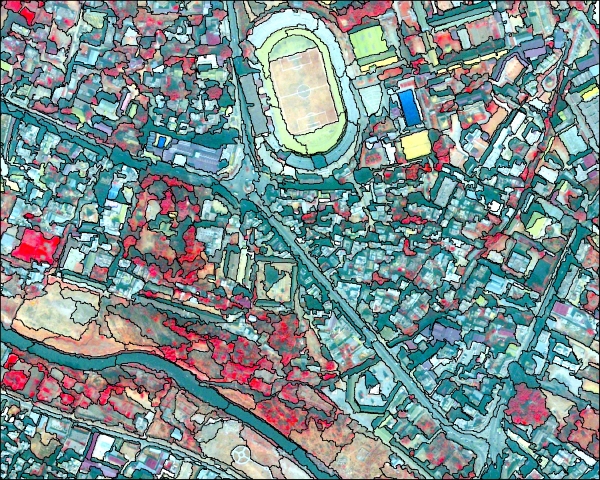 Example of how object-based image analysis works.
The general rule of thumb is that object-oriented classification is best for higher spatial resolution, since objects might consist of multiple pixels, and the other methods work fine for lower resolution (in which objects are just a pixel). Of course, as spatial resolution improves, this means that object-oriented classification might be increasingly adopted in kind.
The type of algorithm matters, too. For example, a highly tailored algorithm might eliminate any false classifications due to shadows by incorporating into its model the position of the sun and relevant ground elevations in the area based on the image’s location and time.
At the forefront of research are different automation techniques to help extract features. Methods leveraging machine vision are one example, as well as methodologies that allow for more variables for classification while maintaining a high level of accuracy (90%+). It’ll likely take a few years for commercially available products to catch up to the research (along with bugs that come out when scaling to product-level use), but highly accurate automation within 5 years doesn’t seem preposterous.
Once features are classified, information can be extracted for its desired purpose. Which leads to the various applications of geospatial analysis.
What are the applications?
There are a bunch of industries that benefit from using satellite-based imagery — particularly for anything in which physical trends over time are needed or they want to see stuff below the Earth’s surface. The number of applications is expanding as imaging capability improves, since higher resolution images provide a more granular view of what’s happening on Earth.
Even though purchasing multispectral imagery can be high in absolute dollar terms, relative to the cost of physical exploration, it is inexpensive. But for non-profit or applications without this high cost of physical capital on the line, the reward isn’t necessarily as high.
Also, assume for any of the following applications, traders can use similar information to inform their financial bets. For example, if satellite imagery suggests that the rate of construction in China is slowing down, they might short construction materials firms or commodities as a result. Of course, this has some intriguing implications for the efficient-market hypothesis, if investors have information on a company’s operations that even the company itself might not possess.
The government has a variety of applications for geospatial imagery, and has been leveraging it as a source of intelligence for half a century. But, I’ll just be focusing on applications within commercial industries.
Current Applications
Agriculture
It can be hard to measure agricultural trends on the ground, so satellite imagery is immensely helpful in assessing crop health and yields, environmental changes and trends pertaining to livestock. Even when planning and maintaining agricultural sites, this imagery can map irrigation and analyze soil — even showing variations in soil’s organic matter.
 Imagery highlighting irrigation.
Aside from optimizing costs and boosting productivity at large agricultural companies, there’s a general global need for improved agricultural production and better utilization of resources. Having a better sense of what and where these resources are to improve their management has significant benefits on a macro scale.
Engineering & Construction
Along with companies in the mining and oil & gas industries, engineering & construction companies have high capital costs relating to physical projects. So, geospatial imagery can help these companies visualize their projects, not just for evaluating and planning construction sites, but also for maintaining them. This helps reduce construction costs and also minimize environmental impact.
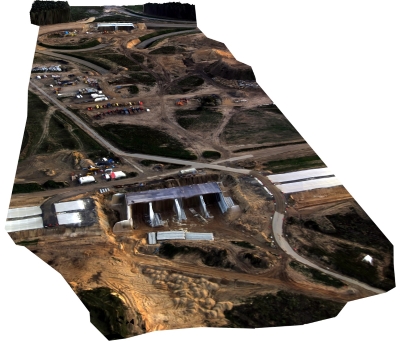 Digital elevation model of a construction site.
Being able to model construction sites in 3D is crucial for planning purposes, but also ensuring ongoing safety. And for certain project types, like airstrips, dams, power plants and sewers, you need data beyond just the visual. For example, when building an airport, not only do you need to make sure the terrain is appropriate for an airstrip, but also have 3D models for flight simulation to make sure pilots aren’t going to run into recurring issues.
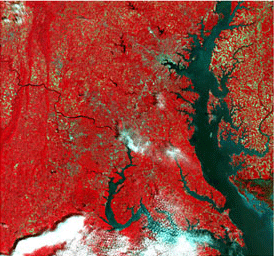
Environmental Monitoring
On the “save the world,” side of things, environmental monitoring helps assess damage from natural disasters as well as help manage natural resources. Governments can use satellite imagery to help develop disaster response plans, as well as improve environmental planning and conservation.
 Imagery highlighting deforestation.
Being able to see high-level trends, like deforestation, is helpful to monitor local environmental health but even more so to evaluate potential long-term impacts. After all, trees don’t grow back overnight, so excessive “forest farming” can have devastating effects on future generations’ economic wellbeing. Not to mention being a harbinger of global climate change.
Logistics (Shipping & Maritime)
Logistics and shipping companies, port operators, fishers, trade organizations and governments all have an interest in geospatial imagery relating to maritime and weather patterns. On the pure logistics side, being able to track ships in transit is highly useful, as tracking systems can fail when far enough away from ports. Weather patterns and other spatial data (like terrain mapping) can also help optimize shipping routes.
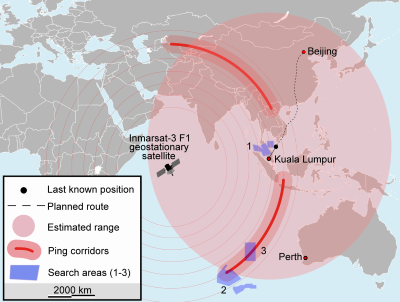 Search for MH370; odd given the number of global recon satellites that it’s still missing.
Being able to monitor trading, spot illegal fishing or piracy, and help with search and rescue missions are of particular importance from a global trade perspective. Even the “little guy” can win — local fishers and fisheries are often put out of business by illegal fishing, which is more widespread than you might think.
Mining
Multispectral satellite imagery has the ability to differentiate between different types of rocks, vegetation and soil, which helps mining and geology projects in a few different ways.
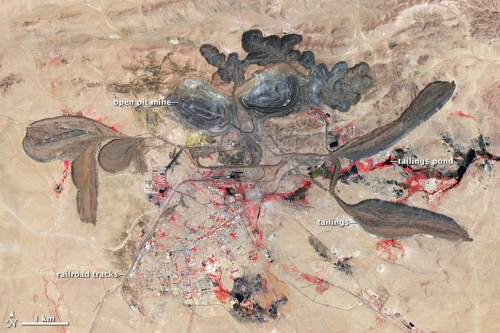 Imagery optimized to show rare earth elements.
First and most obviously, this imagery can help identify clays, oxides and soils for mineral mapping and exploration. This is in contrast to most humans, who would walk to the location and say, “yep, that looks like ground.” All the different energy bands will show both different types of rocks and elements as well as structural aspects of the Earth’s surface that may influence ease of mining.
Second, it helps plan out mining projects. Digging into the ground isn’t the only challenge; mining companies also have to worry about how to get access to the mine and what infrastructure would be required to support the project. And, they also need to estimate what sort of impact the project will have on the surrounding area from a human and environmental perspective.
Oil & Gas
Satellite imagery can help oil and gas companies reduce risk in oil exploration as well as monitor ongoing projects. The level of detail is pretty impressive, from generally detecting areas that are most productive down to even detecting seismic lines or offshore oil seepage.
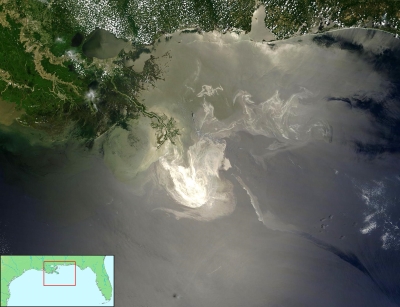 The Deepwater Horizon spill being just a bit more than seepage.
But not only does it help find areas most likely to be rich with oil, but it also helps these companies assess the potential costs and pitfalls associated with drilling in a particular area. For example, satellite imagery shows which areas have rock formations, heavy forest coverage, unfavorable weather conditions and whether they are in more remote or developed locations.
Future Applications
In the next section I’ll talk about some of the challenges that have hindered adoption to date, but if geospatial imagery becomes more widely available and easier to leverage for business and operational intelligence, other industries may become customers in addition to those above.
One potential area is physical retail. A super cool application might be looking at the surrounding area and weather patterns of store locations to see what types of goods might resonate best with local customers. For example, imagery could show the levels and types of vegetation in nearby residential areas to see if stocking more garden supplies makes sense. If imagery can be updated quickly enough, retail companies could see how many cars are at a given location in order to estimate growth or decline. They could also plan new locations based on factors like accessibility or even locations that have lots of cars parked at their competitors’ stores.
In that vein, real estate is another potential application area. Much like for construction projects, real estate developers can improve planning their projects by being able to optimize residential appeal — whether by accessibility, proximity to natural spaces or avoiding high-risk zones. And the same goes for city and urban planners.
The advertising industry could leverage different types of data towards better ad targeting. Someone like Facebook could use satellite imagery to generate a wealth of data about a user’s specific location, that they can then provide as part of their user targeting suite for their customers. This could include the example above of measuring vegetation in residential areas to advertise garden supplies, or knowing proximity to mountains and trails to advertise hiking gear or mountain bikes.
As I’ll discuss a bit later, there’s also the potential that space data startups generate and sell intelligence directly to end customers, which could open up an even wider set of potential applications.
What’s hindering adoption?
There isn’t necessarily one thing hindering adoption of geospatial imagery and intelligence. It’s a combination of availability, costs, latency, quality and usability. All these issues in conjunction means there’s a barrier for many commercial enterprises to using geospatial data to their advantage.
Getting satellites into orbit so there is more imagery available is step one. The goal of many of these imagery companies is to have a constellation of satellites in orbit to allow for daily imaging of the whole planet. Launching these satellites into orbit is currently expensive, and ups the cost of the end imagery (which thereby reduces the potential customer set). So, a lot depends on SpaceX’s (and others’) ability to cut down on the cost of satellite launches. The recent successful Falcon 9 launch and landing will very likely pave the way for rocket reuse, which will help bring down these costs substantially.
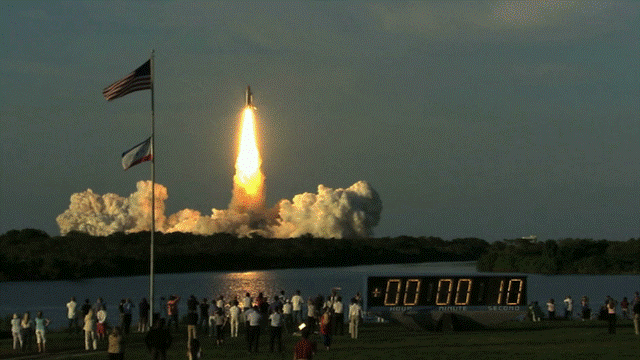 Obligatory cinemagraph in the name of ‘Murica.
The delivery of imagery is historically quite slow as well. Not only do satellites capture a small part of the Earth at a time, but there’s also the issue of sending down large file sizes over transmissions speeds that are just in the hundreds of MB per second range. Assuming there’s no pre-processing before the customer receives the image, the customer still has to download the image for themselves, which takes time…and any processing work needed only adds to that time. This is starting to change, as images are increasingly available online and some images are pre-processed, saving customers from having to do the image processing themselves.
Of course, images will only realistically be “near real-time,” given the transmission delay. But getting down to a matter of minutes, or even hours, is an improvement over the traditional daily or longer wait times. Faster transmission speeds could help improve the speed at which images are received as well.
Launching a satellite into space is no cheap feat, not to mention costs of ongoing operations, resulting in imagery pricing that is quite expensive. Pricing can range from $20 to $25 per square km, and there are often minimum order sizes of 25 square km a pop (meaning $500+).
On the satellite design side, more development is needed in the miniaturization of components. For example, Planet Labs’ satellites are cutely described as “baguette”-size, and that’s the general trend — 172 satellites weighing 100kg (~220lbs) or less were launched in 2014. There are also sensor-related challenges, most which can’t be remediated at the source, putting more onus on the image processing part of the chain. There are multiple tradeoffs within sensors that affect quality: spectral resolution vs. signal to noise ratio (SNR), radiometric resolution vs. SNR, data size vs. spatial resolution, and spatial resolution vs. spectral resolution.
So, there’s a long way to go with image processing software as well, particularly as it pertains to information extraction. Better automation seems to be the path forward towards improving this software, though that isn’t particularly easy, either. It isn’t surprising that automation is perhaps the biggest area of focus among many of the startups in the field. The automation is primarily in the pre-processing (rectification and restoration phase), but also through easier integration (API all the things).
While I wasn’t able to find these claims specifically, after looking at a bunch of traditional GIS software, it has the GUI sophistication of Minesweeper from Windows 95. While I’m sure for users familiar with these interfaces it makes sense and works fine, I can’t help but imagine that a more intuitive and “typical user”-friendly UX might allow for more widespread adoption.
Who cares?
The government has cared a lot for a long time, and I’d have to assume they’d be a little nervous about a bunch of new satellites being sent into orbit that may risk having spy satellites uncovered. But, they would also be able to benefit from innovations, particularly on the software-side, that are spurred by greater commercial adoption. Though based on how homely most government-facing software looks, maybe government analysts would disprove of UI improvements.
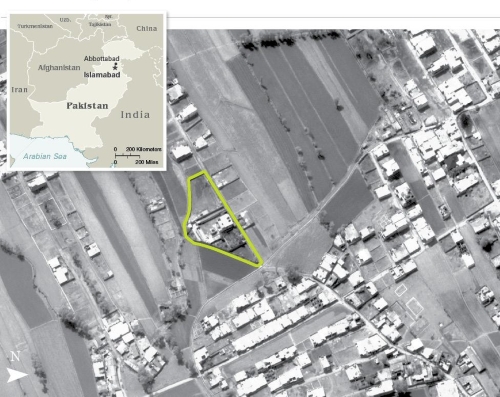 Satellite imagery via the CIA of Osama bin Ladin’s compound.
Any of the commercial industries from earlier might care, as it can help them cut costs, curtail risks and arguably even improve revenues. So, they care to the extent that better satellite imagery and analysis can help them optimize their business, but the degree to which it does may vary. I’d imagine it’s a “nice to have,” maybe even “would love to have,” but not a “necessary to have” in most of these cases.
As described above, there are a lot of “save the world” use cases that could legitimately help improve the environment and even potentially human rights. But generally those budgets are much thinner than for-profit industries.
On the darker side of things, there’s the potential for invasion of privacy. This currently pertains to sub-orbit, but high altitude aircraft (as far as we, the unknowing public, knows), but it certainly isn’t a stretch to imagine being able to detect individuals by thermal spectrum within specific buildings. Or, to watch their patterns of life via satellite — though that could more easily be done by gaining access to their phone’s GPS and location data.
With the recent bill passed to allow companies to retain profits from space mining activities, improvements in these technologies could potentially help these companies scout asteroids and other celestial objects containing valuable elements. It might be tricky from the satellite positioning perspective, but would cut down on the exploration costs enormously if companies could make “sure bets.”
What are the risks?
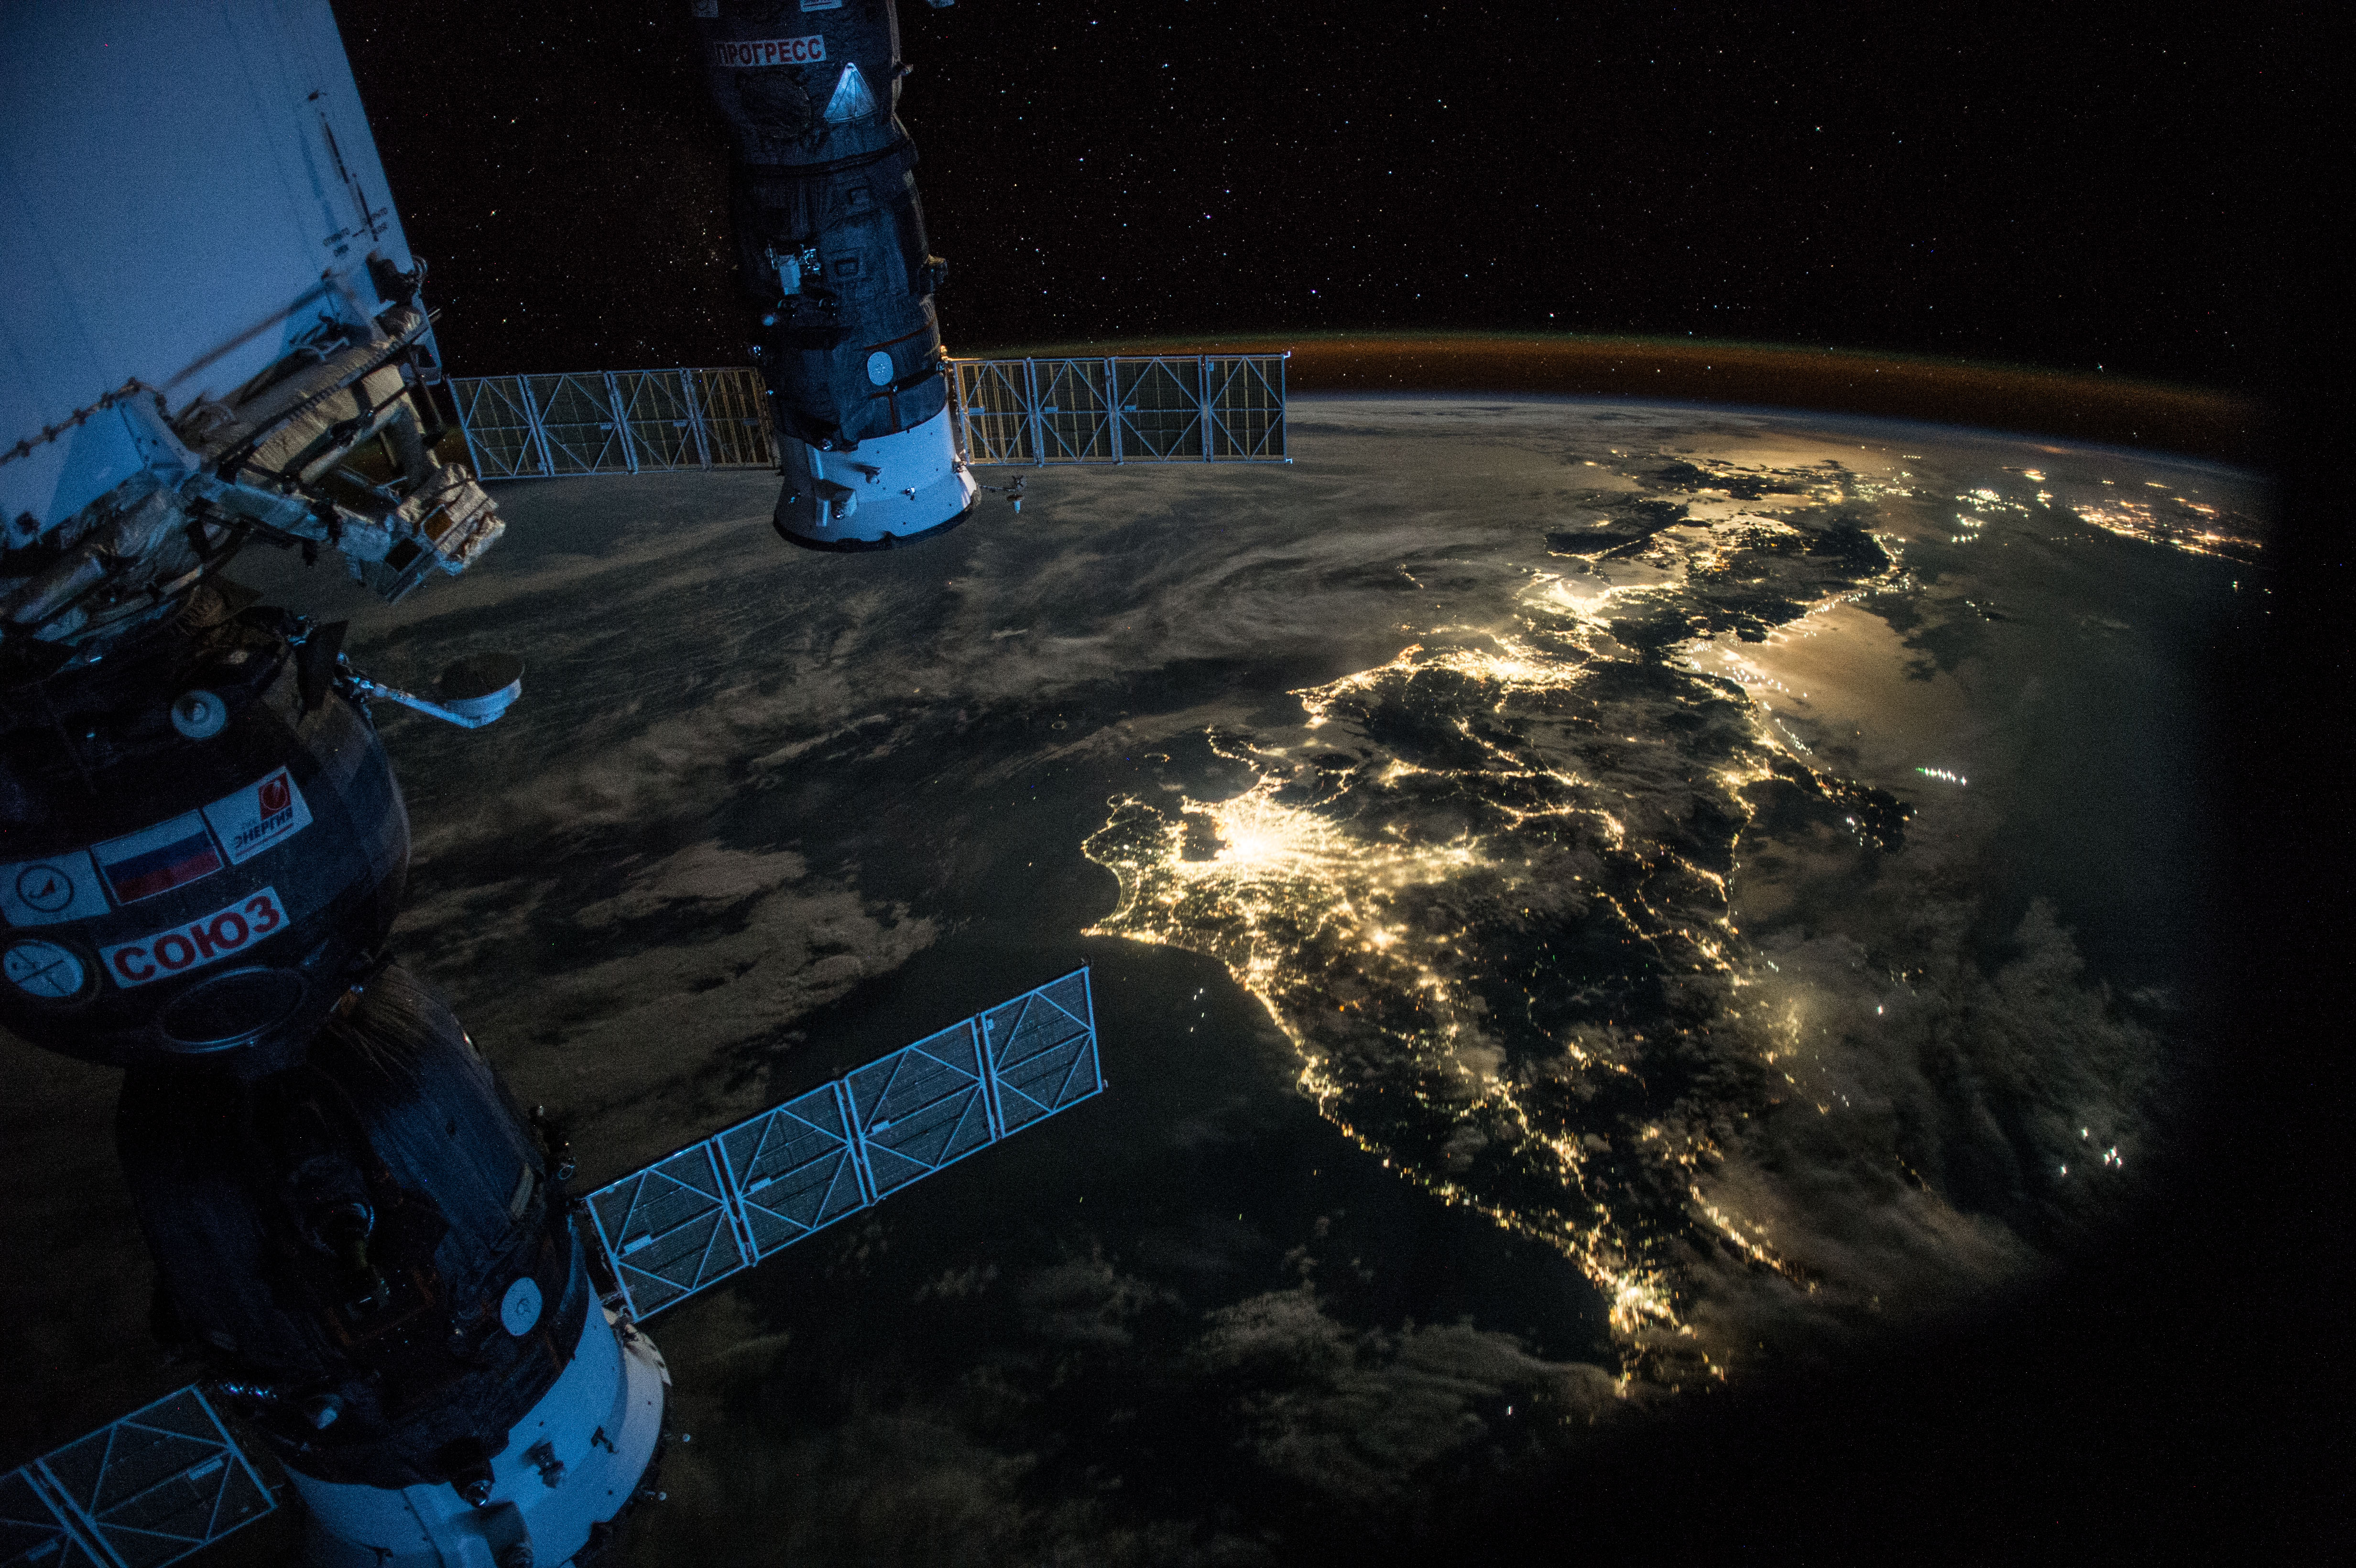
 How a satellite constellation looks.
A lot depends on getting satellites into orbit, at least to make this a huge opportunity. The successful Falcon 9 launch and re-landing helps mitigate those risks a bit, but that happened only weeks ago. So, to get more satellites into orbit, thus increasing not only the amount of imagery, but quality of imagery, you have to hope that SpaceX really has their stuff together and in a hurry. You actually probably need to hope that more than just SpaceX does rocket reuse successfully.
How a satellite constellation looks.
A lot depends on getting satellites into orbit, at least to make this a huge opportunity. The successful Falcon 9 launch and re-landing helps mitigate those risks a bit, but that happened only weeks ago. So, to get more satellites into orbit, thus increasing not only the amount of imagery, but quality of imagery, you have to hope that SpaceX really has their stuff together and in a hurry. You actually probably need to hope that more than just SpaceX does rocket reuse successfully.
Satellite imagery, at least as it stands today, also isn’t that big of an industry. The satellite industry as a whole is a hefty market ($200 billion), particularly because of consumer communications and entertainment. But right now the Earth Observation (EO) market, which includes the satellite imagery portion, is still quite small.
Specifically, the EO market size is just about $2 billion today, which doesn’t leave a lot of room for new players to make a killing. DigitalGlobe and Esri, arguably the largest satellite imagery providers, only made about $650mm and $950mm in revenue in 2014, respectively. Some of the estimates, like from Northern Sky research, put the EO market hitting $3.5 billion in 2020, and $4.5 billion by 2024.
An alternative is betting that even if the imagery part doesn’t grow that quickly, better software and analytics still has the opportunity for significant growth. After all, these tools would help companies get a better bang for their buck when purchasing satellite imagery. But is it a 10x better bang for the buck than it stands today? That’s up for debate, and largely depends on use case. But that’s not the sort of “sure bet” most VCs like.
On the other hand, if the monetization of satellite imagery isn’t via the imagery or software itself, but via the resulting data streams, then there’s arguably less risk. If you’re just selling what would essentially be business intelligence, but collected from Earth’s orbit, you’d undoubtedly find additional interested customers due to the more immediate value proposition. However, companies pursuing this would probably have to control the whole chain — satellites, imagery, processing, etc. — to have differentiated and high-quality data streams, which requires a ton of capital to pursue. So VCs would need to clutch their talismans and hope the all-in bet pays off.
What’s the current scene?
There are not too many startups specifically in the satellite-imagery arena, though there are a few more in the satellite and space category more generally (most notably SpaceX). The ones who are in what I’d call the “geospatial big data” arena are:
- Analyze
- Aquila Space
- BlackSky Global
- CartoDB
- Descartes Labs
- Iceye
- MapBox
- Planet Labs
- Orbital Insight
- Skybox Imaging (acquired by Google)
- Spire
- TellusLabs
- UrtheCast
There are some sub-categories, like tracking weather and maritime conditions (Analyze, Spire), or mapping services (CartoDB, Mapbox). But for the most part there isn’t much overlap between the companies, other than at the highest level. You’ll see terms like “tracking,” “data streams,” and so forth, but they all self-describe quite differently.
The more notable VC funds that have funded some of these ventures are:
- Accel Partners
- Draper Fisher Jurvetson
- Earlybird Venture Capital
- Felicis Ventures
- Founders Fund
- Foundry Group
- Lux Capital
- Promus Ventures
- Razors Edge Ventures
- Rothenberg Ventures
- RRE Ventures
There are also a few larger companies that do provide either satellite imagery, GIS software, or geospatial database management systems, including:
- Autodesk
- Bentley Systems
- DigitalEye
- Esri
- Exelis
- Hexagon Geospatial
- Teradata
There are also a number of open source projects, from software to SDKs and libraries, that are released by non-profit organizations and universities. But they rarely have the same breadth of features, nor the number of capabilities, as the paid software.
Conclusion
 There’s a reason why I like using the term “space data” — this is really cool stuff. But, there are huge capital costs involved for a market that as of yet isn’t very big at all. Or, for companies that are improving just the software part, there’s a lot of reliance on third parties to provide the actual imagery.
Automation does seem like the most legitimate opportunity for a 10x improvement on what is available today, so that companies don’t need GIS experts in-house to still glean intelligence from satellite imagery. It seems like this software vertical is particularly behind in many of the infrastructure developments made in the past decade, so there’s certainly room for disruption just in that regard.
But, what are companies’ ongoing needs for satellite imagery? Many of the applicable industries suggest a per-project need rather than the sort of continuous need best met via SaaS. At the very least, the government is likely willing to throw some money towards better software, but relying on that revenue is unlikely to produce a blockbuster VC return.
The most viable proposition in my eyes is in eliminating the need for companies to have to even touch satellite imagery and give them the information they need to know, i.e. the data stream approach. It feels like a truly modern way of approaching business and operational intelligence with a large potential audience. And hedge funds would probably eat it up.
My main hesitation here would be in vertical-specific needs, and to a lesser extent, in pricing. My gut feeling is that, at least in early days, the data received by customers would require a heavy level of customization based on their needs, making the business almost like a software and data-enabled consultancy (which is arguably working out for Palantir). And as a result, the pricing might still be prohibitive to many customers — not to mention the initial and ongoing costs of maintaining a constellation of satellites.
My prediction is that many of the software-only companies will remain quite small, while those pursuing the entire chain (like Planet Labs) have a good shot at a big long-term payoff (with bigger capital requirements, of course). DigitalGlobe itself only has a $1 billion market cap, with about $100mm cash, so they can’t just gobble up the new software companies. There’s always the chance a cash-rich tech giant like IBM or Facebook decides they’re interested in the space data game, too. Or perhaps I’m wrong and space mining comes sooner rather than later, with space data crucial for any level of success.
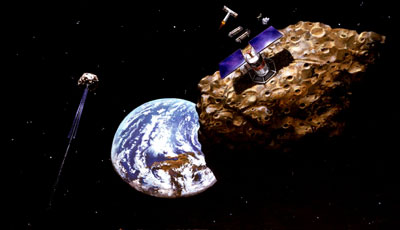 Asteroid mining — the not so distant future?